WIOA Performance
The Workforce Training and Education Coordinating Board is Washington’s workforce system performance accountability agent, working on behalf of the state’s citizens and employers. The Workforce Innovation and Opportunity Act (WIOA) require states to set performance targets for the Title I-B Adult, Dislocated Worker, and Youth programs. The Workforce Board develops the process leading to these targets as well as coordinates and administers the state’s policy of performance sanctions.
Partners and Key Concepts
The main parties to the process are U.S. Department of Labor (DOL), Local Workforce Development Boards (LWDB), Washington State Employment Security Department (ESD), and Workforce Training and Education Coordinating Board (WTB)
Regions
In the presentations below there are effectively 13 areas – the 12 Local Workforce Development Boards, and the State.
Programs
The Workforce Board is tasked with evaluating the 3 programs WIOA Adult, WIOA Dislocated Worker, and WIOA Youth. In addition to these we have also included Wagner-Peyser.
Indicators
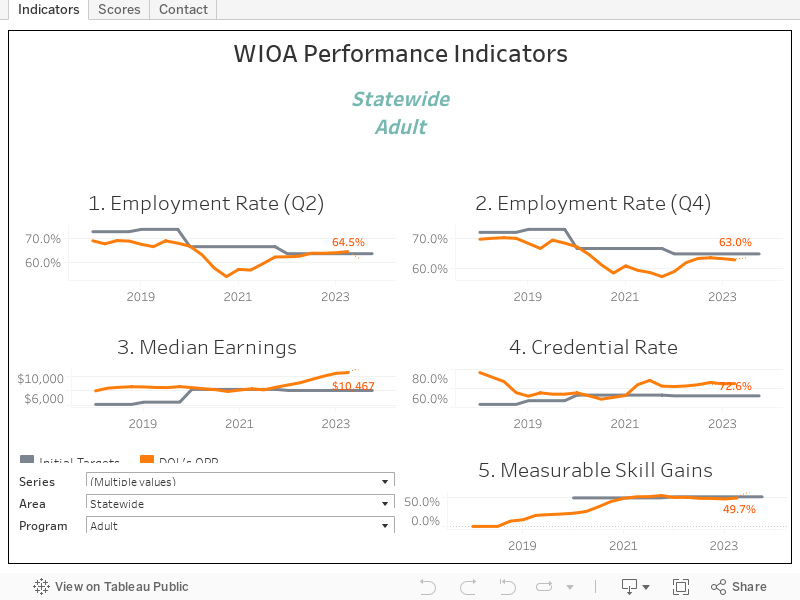
There are 5 indicators: Employment 2 quarters after exit, Employment 4 quarters after exit, Median Earnings (for the 2nd quarter after exit), Credential Attainment (participation through 4 quarters after exit), and Measurable Skills Gains
Statistical Adjustment Model (SAM)
A model is used to assess expected performance prior to the program year. After the program year, the same model is used again, but now with the known participant demographics and economic conditions. The difference between pre- and post-program year prediction is the source of the adjustment in targets. The model used for statewide target adjustment originates with the U.S. Department of Labor (DOL) and is referred to as the Federal or the National SAM. The model used for local area targets comes from by the Workforce Board and is referred to as the Local SAM.
Participant Individual Record Layout (PIRL)
Participant level data provided by the states’ management information systems and reported quarterly to DOL.
Quarterly Performance Report (QPR)
Every quarter, DOL tabulates data from the PIRL and presents the results to the states as Quarterly Performance Results (QPR). In Washington these are made available by the Employment Security Department. Get the latest results here.
Targets
Initial targets are set before participant characteristics and economic conditions facing participants are known. Adjusted targets incorporate participant characteristics and economic conditions not known at the time of initial targets. State level targets are adjusted by using the National SAM, while local targets are adjusted by the Local SAM.
Assessment and Score
Assessment of performance is done by considering an indicator (actual) performance as a percentage of the adjusted target. This ratio, referred to as score or indicator score, will have DOL’s QPR in its numerator and the adjusted target in the denominator. Overall scores across measures and across programs are arithmetic averages of individual indicator scores.
Timeline
The timeline below is arranged by program year. A program year runs from July through June and is named by either referring to both calendar years involved, or, more commonly, using the first of the two calendar years. Key events are bulleted and dated by deadline. A previous version of this list had quarterly reports listed. These are now delegated to a workbook found under “Tools and Methods”.
Program Year 2023 (July 1, 2023 – June 30, 2024)
- 2023-10: PY 2022 Performance available
- 2024-03: PY 2022 Assessment (Adjusted Targets and Scores), State and Local
- 2024-06: PY 2024/2025 Initial Targets, State
Program Year 2024 (July 1, 2024 – June 30, 2025)
- 2024-09: PY 2024/2025 Initial Targets, Local
- 2024-10: PY 2023 Performance available
- 2025-03: PY 2023 Assessment (Adjusted Targets and Scores), State and Local
Program Year 2025 (July 1, 2025 – June 30, 2026)
- 2025-10: PY 2024 Performance available
- 2025-03: PY 2024 Assessment (Adjusted Targets and Scores), State and Local
- 2026-06: PY 2026/2027 Initial Targets, State, (Due to U.S. DOL 6/30/26)
Program Year 2026 (July 1, 2026 – June 30, 2027)
- 2026-09: PY 2026/2027 Initial Targets, Local (Due to U.S. DOL 9/30/26)
- 2026-10: PY 2025 Performance available
- 2027-03: PY 2025 Assessment (Adjusted Targets and Scores), State and Local
Program Year 2027 (July 1, 2027 – June 30, 2028)
- 2027-10: PY 2026 Performance available
- 2028-03: PY 2026 Assessment (Adjusted Targets and Scores), State and Local
- 2028-06: PY 2028/2029 Initial Targets, State, (Due to U.S. DOL 6/30/28)
State and Local Assessments
PY 2024 Performance Assessment, Local Areas
PY 2024 Performance Assessment, All States
PY 2024 Performance Assessment, Washington
PY 2023 Performance Assessment, Local Areas
PY 2023 Performance Assessment, All States
PY 2023 Performance Assessment, Washington
PY 2022 Performance Assessment, Local Areas
PY 2022 Performance Assessment, All States
PY 2022 Performance Assessment, Washington
PY 2021 Performance Assessment, All States
PY 2021 Performance Assessment, Washington
PY 2020 Performance Assessment, All States
PY 2020 Performance Assessment, Washington
PY 2019 Performance Assessment, Washington
Performance Sanctions Policy
Performance Accountability Work Group Meetings (Video)
Tools & Methods
Training and Employment Guidance Letter (TEGL) 10-16
Training and Employment Guidance Letter (TEGL) 11-19
LSAM26_Scenarios_01-Olympic Consortium (53010)
LSAM26_Scenarios_02-Pacific Mountain (53015)
LSAM26_Scenarios_03-Northwest (53020)
LSAM26_Scenarios_04-Snohomish (53030)
LSAM26_Scenarios_05-Seattle-King (53025)
LSAM26_Scenarios_06-Pierce (53040)
LSAM26_Scenarios_07-Southwest (53005)
LSAM26_Scenarios_08-North Central (53045)
LSAM26_Scenarios_09-South Central (53075)
LSAM26_Scenarios_10-Eastern (53070)